XY Graph
Description
This example shows how to use the Microsoft Office Chart ActiveX Control.
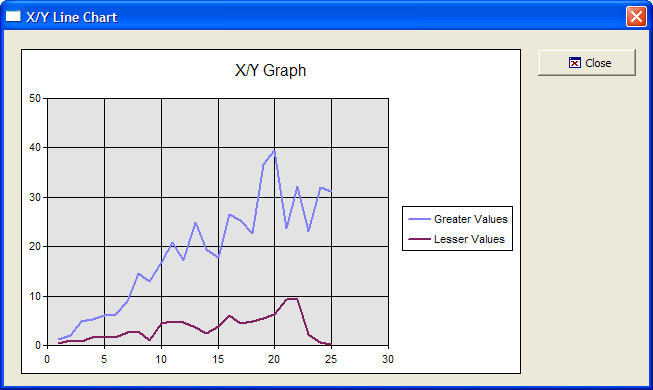
Example
dim vl as P
dim shared Chart as P
dim Graph as P
dim Graph.object as P
dim Graph.class as C
vl = local_variables()
'Define the Microsoft Office Chart ActiveX Control
Graph.class="owc.chart"
dlg_title = "X/Y Line Chart"
dlg_source = <<%dlg%
{can_exit=close}
{startup=init}
{lf};
{region001}
{stretch=height,width}
{sp}{activex=100,25Graph};
{stretch=}
{stickto=right,top}
{endregion001}
{region002}
{sp}<%i=$a5_window_close;O={J=C} {I=1} Close; %18,1.5&Close!close>{sp};
{endregion002}
%dlg%
Add the event handlers for the buttons.
dlg_event = <<%code%
if (a_dlg_button = "close") .or. (a_dlg_button = "") then
    ui_modeless_dlg_close(dlg_title)
end if
if (a_dlg_button = "init") then
    a_dlg_button = ""
Build the chart on the init event. Series[2] is an array of pointers. each element in the array contains information about a data series that is plotted on the graph.
dim Series[2] as P
    dim Rows as N
    Rows = 25
    dim XValueRows as N
    dim YValue1Rows as N
    dim YValue2Rows as N
    ' Add a chart to the graph object
    Chart = Graph.object.Charts.Add()
    Chart.HasTitle = .T.
    Chart.Title.Caption = "X/Y Graph"
    Chart.Type = 25 ' Scatter Line - See the Complete List of Supported Chart Types.
    Chart.HasLegend = .T.
    ' Create some random data for the graph
    for i = 1 to Rows
        XValue[i] = i                 ' Just a sequence 1..25
        YValue1[i] = rand()* i + i ' A random number greater than i
        YValue2[i] = rand()* i / 2 ' A random number smaller than i
    next i
    ' Add the two series to the chart
    Series[1] = Chart.SeriesCollection.Add()
    Series[1].Caption = "Greater Values"
SetData() is a method call of the chart object. The arguments passed in the first call to .SetData() are:
4, indicating that we are setting an X value (see Complete List of Supported Data Types )
-1, indicating that the data is being supplied directly, rather than from a data source
XValue, containing the name of the array that contains the actual values.
Series[1].SetData(4, -1, XValue)
	' X Values for Series 1
The arguments passed in the second call to .SetData() are:
3, indicating that we are setting an Y value (see Complete List of Supported Data Types )
-1, indicating that the data is being supplied directly, rather than from a data source
YValue, containing the name of the array that contains the actual values.
Series[1].SetData(4, -1, XValue)             ' X Values for Series 1
    Series[2] = Chart.SeriesCollection.Add()
    Series[2].Caption = "Lesser Values"
    Series[2].SetData(4, -1, XValue)             ' X Values
    Series[2].SetData(3, -1, YValue2)            ' Y Values
    Graph.object.Refresh()
end if
%code%
ui_modeless_dlg_box(dlg_title, dlg_source, dlg_event)
Complete List of Supported Chart Types
'chChartTypeColumnClustered = 0,
'chChartTypeColumnStacked = 1,
'chChartTypeColumnStacked100 = 2,
'chChartTypeBarClustered = 3,
'chChartTypeBarStacked = 4,
'chChartTypeBarStacked100 = 5,
'chChartTypeLine = 6,
'chChartTypeLineStacked = 8,
'chChartTypeLineStacked100 = 10,
'chChartTypeLineMarkers = 7,
'chChartTypeLineStackedMarkers = 9,
'chChartTypeLineStacked100Markers = 11,
'chChartTypeSmoothLine = 12,
'chChartTypeSmoothLineStacked = 14,
'chChartTypeSmoothLineStacked100 = 16,
'chChartTypeSmoothLineMarkers = 13,
'chChartTypeSmoothLineStackedMarkers = 15,
'chChartTypeSmoothLineStacked100Markers = 17,
'chChartTypePie = 18,
'chChartTypePieExploded = 19,
'chChartTypePieStacked = 20,
'chChartTypeScatterMarkers = 21,
'chChartTypeScatterLine = 25,
'chChartTypeScatterLineMarkers = 24,
'chChartTypeScatterLineFilled = 26,
'chChartTypeScatterSmoothLine = 23,
'chChartTypeScatterSmoothLineMarkers = 22,
'chChartTypeBubble = 27,
'chChartTypeBubbleLine = 28,
'chChartTypeArea = 29,
'chChartTypeAreaStacked = 30,
'chChartTypeAreaStacked100 = 31,
'chChartTypeDoughnut = 32,
'chChartTypeDoughnutExploded = 33,
'chChartTypeRadarLine = 34,
'chChartTypeRadarLineMarkers = 35,
'chChartTypeRadarLineFilled = 36,
'chChartTypeRadarSmoothLine = 37,
'chChartTypeRadarSmoothLineMarkers = 38,
'chChartTypeStockHLC = 39,
'chChartTypeStockOHLC = 40,
'chChartTypePolarMarkers = 41,
'chChartTypePolarLine = 42,
'chChartTypePolarLineMarkers = 43,
'chChartTypePolarSmoothLine = 44,
'chChartTypePolarSmoothLineMarkers = 45
Complete List of Supported Data Types
SetData(type, datasourceindex, array)
' Values for type of data being set
'chDimSeriesNames = 0,
'chDimCategories = 1,
'chDimValues = 2,
'chDimYValues = 3,
'chDimXValues = 4,
'chDimOpenValues = 5,
'chDimCloseValues = 6,
'chDimHighValues = 7,
'chDimLowValues = 8,
'chDimBubbleValues = 9,
'chDimRValues = 10,
'chDimThetaValues = 11
See Also